Introduction
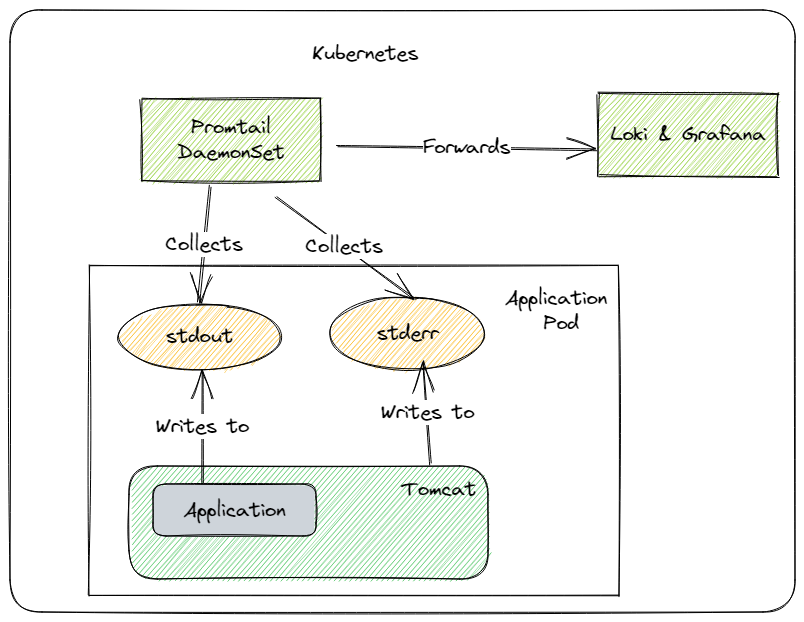
While setting up a central logging for a Kubernetes cluster using Promtail, Loki and Grafana, we wanted to collect the logs of a deployed application. The application itself runs as a Grails app in an older version of Apache Tomcat. The Tomcat and the application is deployed as a Docker container in Kubernetes.
Problems
During setup, we discovered some problems:
-
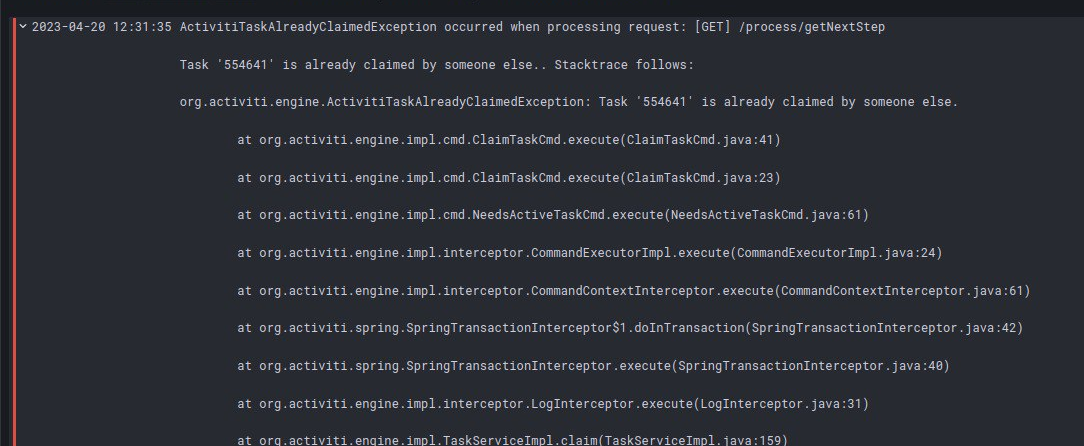
If an exception was thrown in the application or in Tomcat, the multiline string with the stack trace was displayed in Grafana with additional line breaks. This did not have any direct effects, but makes a later error analysis somewhat more difficult.
-
The log formats between Tomcat and the application differed. For other reasons, we could not and did not want to unify the format. This ensured that Promtail or Loki could only store one of the two formats in a structured way.
-
In Grafana the log outputs of both logs were mixed. Thus, it was no longer apparent which log output belonged to the Tomcat or to the application in terms of time.
Additional empty line in Grafana
This one was easy to fix as it has been already mentioned in #3993. In your pipelineStages, add a new replacer stage to remove the line break:
	pipelineStages:
      - match:
	    selector: '{app="myapp"}'
        stages:
          # @see https://community.grafana.com/t/what-is-the-correct-way-to-parse-json-logs-in-loki-promtail/51974
		  - docker: { }
          # @see https://github.com/grafana/loki/issues/3993
          - replace:
              expression: '(\n)'
              replace: ""
Ingesting the different log formats and preventing mixed log outputs
As you can already see in the overview, the Tomcat logs to stderr and the application logs to stdout:
| Tomcat | Application | |
|---|---|---|
| Output to | stderr | stdout |
| Sample log |
|
|
Based on the different output streams, different promtail matchers can also be used. Here we benefit from the fact that in Promtail a matcher can in turn have stages:
	pipelineStages:
      - match:
          selector: '{app="myapp"}'
          stages:
		    # @see https://community.grafana.com/t/what-is-the-correct-way-to-parse-json-logs-in-loki-promtail/51974
		    - docker: { }
            # @see https://github.com/grafana/loki/issues/3993
            - replace:
                expression: '(\n)'
                replace: ""
            - match:
                selector: '{container=~"myapp-.+-application"}'
                stages:
                  - match:
					  # Application output
					  selector: '{stream="stdout"}'
                      stages:
                        - multiline:
                            firstline: '^\d{4}-\d{2}-\d{2}\s\d{1,2}\:\d{2}\:\d{2},\d{3}.+'
                            max_wait_time: 3s
                        - regex:
                            expression: '^(?P<timestamp>\d{4}-\d{2}-\d{2}\s\d{1,2}\:\d{2}\:\d{2},\d{3})\s+\[(?P<thread>[\w\d\-\[\]]+)\]\s(?P<level>\w+)\s+(?P<logger>[\w\.]+)\s+-\s(?P<message>(?s:.*))$'
                        - timestamp:
                            source: timestamp
                            format: '2006-01-02 15:04:05,999'
                            location: Europe/Berlin
                        - labels:
                            thread: thread
                            level: level
                            logger: logger
                        - output:
                            source: message
                  - match:
					  # Tomcat output
                      selector: '{stream="stderr"}'
                      stages:
                        - multiline:
                            firstline: '^\w+\s\d{2},\s\d{4}\s\d{1,2}:\d{1,2}:\d{1,2}\s\w{2}.+'
                            max_wait_time: 3s
                        - regex:
                            expression: '^(?P<timestamp>\w+\s\d{2},\s\d{4}\s\d{1,2}:\d{1,2}:\d{1,2}\s\w{2})\s(?P<logger>[\w\.]+)\s(?P<thread>\w+)\n(?P<level>\w+):\s(?P<message>(?s:.*))$'
                        - timestamp:
                            source: timestamp
                            format: 'Jan, 1, 2006 3:04:05 PM' #Mar 16, 2023 5:08:52 PM
                            location: Europe/Berlin
                        - labels:
                            thread: thread
                            level: level
                            logger: logger
                        - output:
                            source: message
As a side effect, by separating the different streams, the mixed log output was also fixed.